Evaluating the capacity and autonomy of the chilean state services
The importance of the interdisciplinary factor in a data project with connotation in political science
INTRODUCTION
The resolution of current problems involves the convergence of different disciplines and researchers with different academic backgrounds, who contribute with complementary and enriching points of view. This confluence of various specialties must be symmetrical, interactive, and dynamic to articulate the different approaches in constructing a common objective and achieving operability in a work team determined to find the solution to the problem posed. This is the case of the problem solved in the ANID Fondef IDeA I+D project: “Towards the modernization of the State: Analytical modeling of state capacities with staffing data”.
Specialists in political science and state administration met with engineers, mathematicians, statisticians, and data scientists to respond to the proposed challenge. The integration achieved with this interdisciplinary strategy was appropriate to disarm a highly complex problem full of different edges into manageable challenges that were later integrated to reach the final solution.
Anecdotally, during work discussions throughout project execution, the boundaries of disciplines became blurred. Even spontaneously and frequently, the jargons of each specialty were merged at times. A specialist in political science could be heard commenting on mathematical models with absolute confidence. It was also common for a statistician to express himself without hesitation on issues associated with State services. In this dynamic, where the fundamental and only objective is to solve the problem with the best available tools, the interdisciplinary seems to achieve its actual impact.
THE PROBLEM POSED
The problem addressed in the project has its origin in political science, but different specialties are involved in its resolution. In political science and related disciplines, there has always been an interest in understanding the state causes behind persistent problems of poor governance, corruption, and poor public policy outcomes. In this context, the Capacity and Autonomy of the different State services are considered essential indicators. Capacity is conceived from the professionalization and bureaucratic quality of the administrative organizations of the State and Autonomy as the independence
of the bureaucracy with respect to political parties (Fukuyama, 2013). However, measuring these indicators is not a simple problem. One possibility is to verify government effectiveness, under the premise that States are more capable to the extent that they are more effective. However, this measure of effectiveness is a composite indicator that incorporates and mixes aspects such as the quality of the civil service with other results, such as the absence of corruption. Suppose the objective is to understand how and to what extent state capacity affects public goods provision. Using results
to measure capacity makes the whole exercise tautological. Therefore, these types of measures should be discarded.
Another problem is that bureaucratic quality measures are built based on expert perceptions and judgments. It is difficult to be sure of the consistency of measures based on expert perceptions when these change over time, or even between experts who may disparately understand (and assess) complex concepts such as “clientelism” or “corruption”. The third problem is that all the measures of bureaucratic capacity used so far give a single score to the bureaucracy of the entire country. The mixed reality of the multiple ministries and services that make up the national bureaucracy is summarized in a single number. Nonetheless, the same literature on the State has highlighted the possible coexistence of areas given over to patronage along with others that constitute ” pockets of efficiency ” (Bersch, Praca & Taylor, 2017). As Fukuyama (2013, p.354) says, “given that state capacity varies substantially across the various functions, levels of government, and regions; ideally one would want to have capacity measures for the main government agencies”.
In a recent publication (Bersch, Praca & Taylor, 2017), Capacity and Autonomy were considered latent variables and estimated from indicators built with administrative and staffing data from Brazilian state agencies. The authors note that their measure of capacity “is intra-national, addressing individual bureaucracies within the national state; objective, based on administrative data on individual actors rather than subjective evaluations by
experts; and generated independently of results” (Bersch et al., 2017, p.105). However, beyond this publication, the study of public bureaucracies in Latin America has received little attention. In Polga-Hecimovich & Trelles, 2016, the authors state that an impediment lies in “the difficulty of collecting, maintaining and sharing data on public agencies, the civil service and the State in Latin America” (ibid., p.71).
With this background, the problem posed was to create a database with information on the State of Chile’s staffing and generate various indicators that allow characterizing the different State services and eventually relate them to their capacity and autonomy.
THE PROCESS OF GATHERING AND PREPARING
THE DATA
The State, in its activity, generates an enormous volume of data, but a majority proportion of it is rarely used. Beyond collecting and storing data, these must be modeled in the context of a solid theoretical framework to extract knowledge and give it value. The project proposal was precisely to address the use of public data generated by the State (in particular, staffing data), using a theoretical framework provided by the team’s political scientists. Thus, the team’s data scientists collected all the staffing records of the State of Chile published and distributed in thousands of tables and hundreds of sites, because of the law of active transparency, in the so-called Transparency Portals, made available by the National Council for Transparency.
Significant challenges were posed in preparing the data. Data from 381 divisions of 25 ministries were considered, including intendancies, governorates, regional health services, and public hospitals (more than 300,000 officials/year), over 15 years (2006-2020), gathering more than fifty million records in the database. One of the drawbacks was using the full name as an identifier of the public server. Multiple errors in the spelling of the name complicated the identification. Disambiguating identification is a critical part of making data useful. It took substantial consensual work from the team’s data scientists, cloud computing specialists, and political scientists to achieve a highly accurate result.
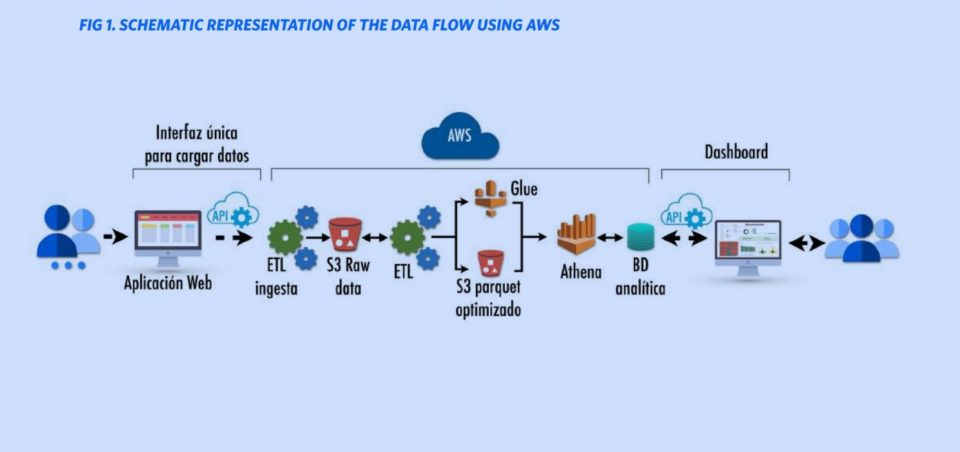
All the processes used already refined for the ingestion, homologation, cleaning of the data, in addition to the disambiguation of the identification (“Record Linkage”), were automated in the Amazon Web Service (AWS) cloud (see figure 1).
DATA ANALYSIS
The existing databases on the endowment of the Chilean State are either not publicly available or only use aggregated data at the level of ministries. Instead, the data generated in this project is public and has high resolution. In other words, the information recorded is referred to individually. It characterizes the different “stories” of officials who have worked or continue to work in the State.
The Service is used as the basic unit of investigation for the analysis and interprets the data as “panel data”. Each service is characterized over time, and “cross-sections” are established to compare the different services at a given moment.
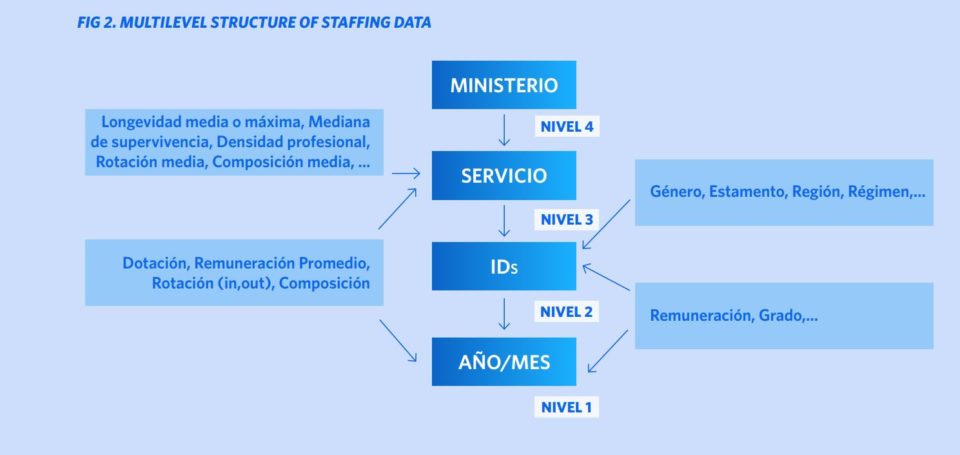
The data structure is complex and consists of multiple levels. The individuals are nested within the services, and these are nested within the ministries; in addition, the “first-level” variables contain records that vary over time (figure 2). The data can be modeled at these different levels (mainly using mixed models), making it possible to compare/differentiate between services using different metrics. The 15-year interval allows a quantitative analysis of civil servant careers and the evolution of services over time. As a result, longitudinal analysis of national bureaucracies, which historically hampered a paucity of continuous data, is now possible.
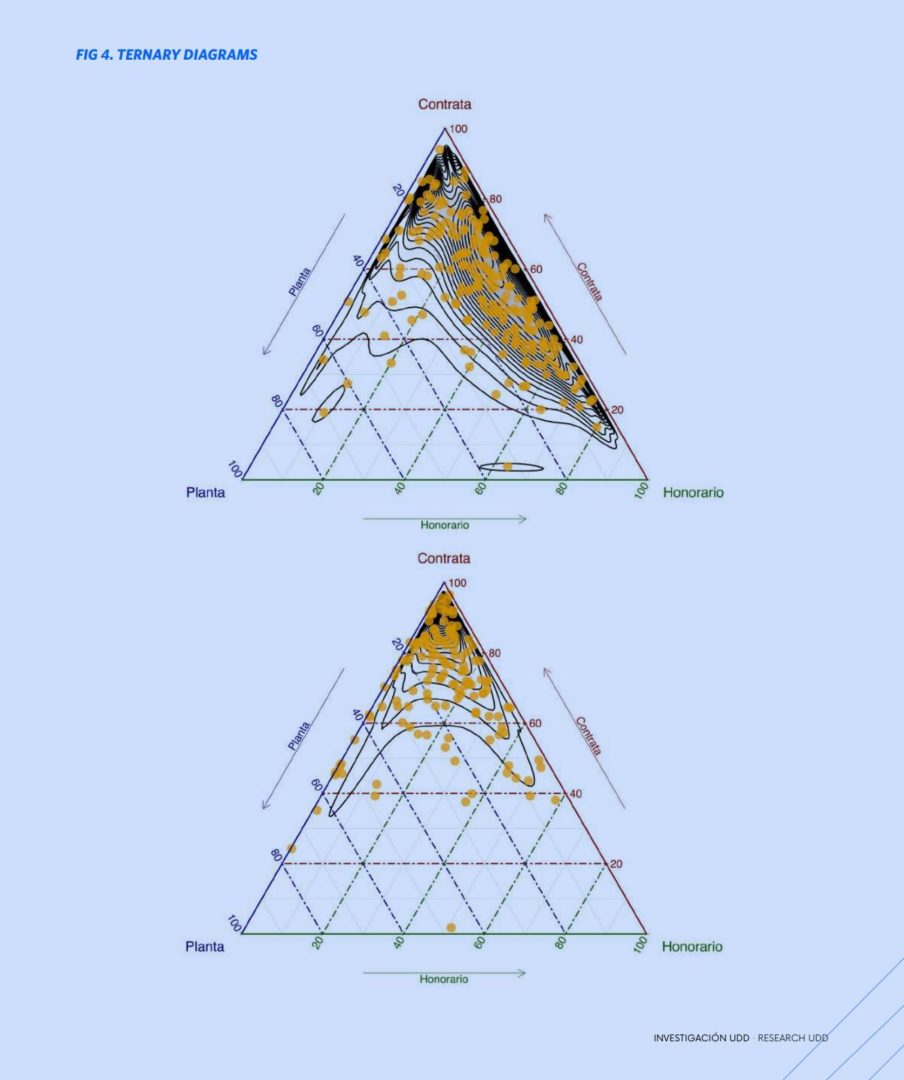
The different services are characterized by their “dimensions”, given by indicators built with raw data. The basic dimensions are: staffing defined as the number of different individuals in the service; the workforce parameterized by sex, regime, or status defines the composition; staff longevity is calculated from service entry/exit dates; turnover is the number of individuals who leave the service in a given year, divided by the year’s workforce (we differentiate the “out ” turnover, given by those who leave the service, from the “in”, given by those who join service); and monthly and individualized remuneration.
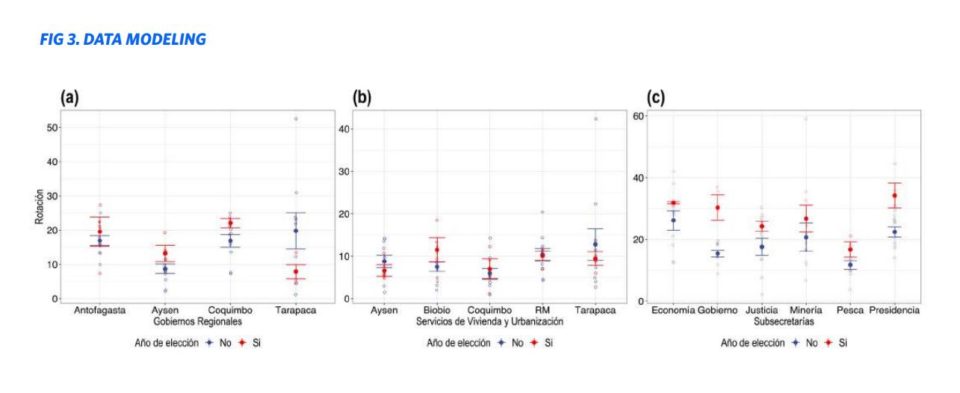
In the modeling, the distributions of longevities and remunerations are used. The Kaplan-Meier curves were used to estimate the risk of staff attrition; an indicator of the service defined here is the time (month) that corresponds to the probability of survival of 50% in said service. Whereas Cox regressions were used to estimate risk rates and make comparisons between services, which can quantify the effect of Ministry/Service on dropout risk. Higher risks rates may imply difficulties forming stable teams, decreasing service capacity. Additionally, other indicators are estimated: Proportion/Density of professionals, Proportion of officials with the same paternal and maternal surnames, Budget execution rate, and others.
In their different contexts (sex, region, status, and others.), these indicators are displayed on interactive dashboards , which describe the evolution, heterogeneity, and composition of State personnel (25 ministries). Due to the size of its endowment, the boards of the Ministry of Health (112 services) were constructed separately from the rest of the other 24 ministries (269 services) for a more detailed analysis.